Multi-spectral imaging for the Codex Sinaiticus
Barry Knight, Head of Conservation Research, The British Library
At the outset, it was envisaged that parts of the Codex would be difficult to image adequately, because of the paleness of the ink or the amount of ink loss. It was thought that the scholars transcribing the text might have difficulty in reading some passages, or that there would be ambiguities where letters had been erased or substituted. We therefore decided to investigate methods of enhancing the amount of information that could be obtained photographically, by imaging beyond the limits of the visible spectrum.
It has been known for a long time that additional information can be obtained from manuscripts by using ultra-violet light, and a UV lamp has long been a useful tool for the scholar examining manuscripts. Infra-red light has been less used for the study of manuscripts, but is fairly widely used for the study of easel paintings, particularly for revealing under-drawings and pentimenti [1]. Multi-spectral imaging (extending from the visible to the near infra-red region of the spectrum) has been developed at a number of institutions, such as the National Gallery, London, and has enabled large format easel paintings to be scanned at very high resolution at a large number of wavelengths [2]. The equipment has tended to be self-built to meet the individual gallery’s requirements, and has required specialist staff to design and operate it.
In comparison, the British Library’s requirements were more modest: the bulk of the imaging would be carried out by the Imaging Services team, using large format digital cameras[3], while multi-spectral imaging would be carried out by conservators and would be limited to small areas where reading the text was difficult or ambiguous. In addition, the library does not employ a specialist imaging scientist, so any equipment acquired would need to be off-the-shelf and straightforward to operate.
After considerable research and discussion, we decided to acquire a MuSIS (Multi-Spectral Imaging System), developed by Forth Photonics in Athens [4]. This instrument was designed specifically for imaging heritage items, such as wall paintings and manuscripts. It is compact and portable and has a very sensitive detector, which means that high-power lighting is not needed, thus reducing the risk of damage to objects. It is simple to use, being controlled through a Windows interface on a laptop. In addition, working with the National Library in Athens, Forth Photonics developed procedures for resolving palimpsests, in other words, being able to distinguish the underwriting from the overwriting on parchment manuscripts that have been cleaned and re-used. It was felt that this could also be useful for examining the Codex Sinaiticus.
In essence, the MuSIS is a digital camera equipped with a series of narrow-band filters, which enable it to record images at 32 different wavelengths between 400 and 1000nm. It is thus able to record the whole of the visible spectrum and well into the near infra-red. It has a 1600 x 1200 pixel sensor, which is not large by current digital camera standards, but which gives a resolution of 600dpi when focused on an area 50 x 67mm. This is enough to cover one column by four or five lines of the text and is therefore appropriate for our purposes: we never intended to use the MuSIS to image whole folios of the Codex.
When working in “Acquire” mode, the MuSIS is first calibrated using a standard white specimen: this has a reflectance of 98 ± 0.5% from 250 to 2000nm. This enables standardised images to be recorded and true reflectance spectra to be calculated. An “image cube” of 32 images covering the whole spectrum is then acquired, and this can be digitally manipulated to reveal or enhance features that are only visible with difficulty, or not at all, to the naked eye. The software ensures that all the images are correctly registered when they are displayed on screen.
Images can be displayed as black-and-white images at a single wavelength, or in colour (RGB) by combining the images at three different wavelengths. It is also possible to display a false-colour infra-red image (IR, R, G), which can be useful for revealing features that are visible in the infra-red but not in the visible region of the spectrum.
A number of analytical operations on the images are possible, which can also be used to manipulate their appearance. For a colour image, the hue, saturation and intensity distributions of a selected area can be displayed, and the colour difference between different areas can be calculated. For a black-and-white image, the grey scale distribution can be displayed, and the contrast and brightness can be manipulated in order to accentuate features of the image.
Reflectance spectra are useful for comparing the properties of different coloured areas, for example, to choose the wavelengths at which there is maximum contrast between two inks, or between the ink and the substrate. Reflectance spectra can also be used to characterise and identify pigments.
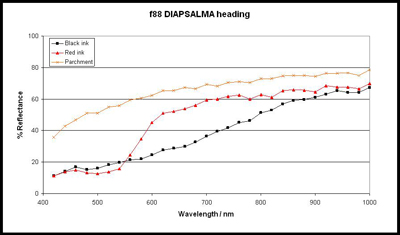
As an example, the reflectance spectra of the red and black inks on folio 88 were measured (Fig. 1). When working in “View” mode, the reflectance spectrum of a single pixel can be displayed by moving the cursor over the image. This means that spectra can be recorded from small adjacent areas of different colours, or at different points within a single pen stroke. The data can be captured as a text file and can then be exported to Excel. In this case, spectra were captured at ten points in the word DIAPSALMA (written in red), exported to Excel and averaged to reduce the amount of variation and give a smoother curve. In the same way, spectra were captured at ten points in the black text above and below DIAPSALMA, and at ten points from the blank parchment between the lines. The smoothed curves are shown in Fig. 2.
The reflectance of the parchment and both inks increases as the wavelength increases, being between 70 and 80% at 1000nm. This means that both inks become more reflective (less opaque) at longer wavelengths, and the contrast between them decreases. The reflectance of the parchment is lower at the blue end of the spectrum (shorter wavelengths), increasing towards the red end (longer wavelengths). This explains its pale yellow colour. The reflectance of the black ink is low at short wavelengths, increasing fairly uniformly towards long wavelengths. The red ink reflects very little light at the blue end of the spectrum (less than the black ink), but its reflectance increases sharply above 550nm until it is only slightly less than the parchment at 600nm.
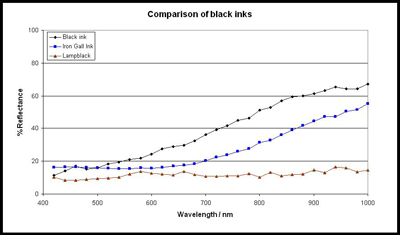
These reflectance spectra may be compared with the spectra of standard pigments. In Fig. 3, it is clear that lampblack (carbon) alone can be ruled out as the black pigment, and that the spectrum of the black ink is more similar to the spectrum of iron gall ink. The identification is not conclusive: differences may be due to the age of the Codex and different methods of preparation. It is also possible that the ink contains some carbon as well as iron gall ink.
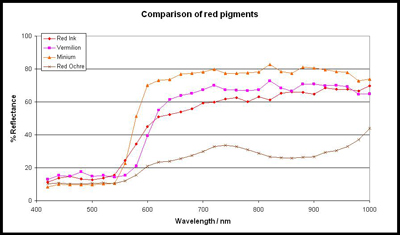
Similarly, comparison of the reflectance spectrum of the red ink with those of possible red pigments shows that red ochre can be ruled out (Fig. 4). The spectrum is more similar to that of vermilion (mercuric sulphide, HgS) than that of minium (red lead, Pb3O4), but again the identification is not conclusive [5]. The colour of the ink is more similar to vermilion (dark red) than minium (more orange), but the appearance will be affected by the particle size and the thickness of the ink.
Unfortunately, there are no comparable analyses of inks on other Greek manuscripts of the 4th century. However, these results are consistent with the findings of an investigation of the Vercelli Gospels, written in Latin and probably dating from later in the 4th century. Using X-ray fluorescence and Raman spectroscopy, it was shown that the original text was written using iron gall ink and vermilion, while later notes and additions were made using carbon and minium-based inks [6].
As the project progressed, it became apparent that the quality of the digital images being generated by the BL Imaging Services team was so high that the scholars working on the transcription of the text had no difficulties in reading even dubious (overwritten or erased) letters, so in the event the capabilities of the MuSIS were not tested. Nevertheless, it was useful to have the MuSIS on hand, as it could not have been predicted that the digital images would be completely adequate for the task of transcribing the Codex.
Conclusions
- Multi-spectral imaging was chosen to complement the work done by the British Library’s Imaging Services team, with the expectation that it would help to resolve dubious or ambiguous passages.
- The intention was not to rival the systems used by the National Gallery and other institutions for high-resolution multi-spectral imaging of easel paintings, but to image small areas of the manuscript where the reading was uncertain.
- The MuSIS, manufactured by Forth Photonics, met our requirements, producing images of adequate resolution for our purposes.
- The MuSIS can produce reflectance spectra of the different inks used in the Codex, which can assist in identifying the pigments used. It is probable that the black ink is iron gall ink, and the red contains vermilion.
- The digital images produced by the BL Imaging Services team were of such high quality that the scholars had no difficulty in transcribing even hard-to-read parts of the manuscript.
References
[1] van Asperen de Boer, J.R.J., Infra-red reflectography: a method for the examination of paintings, Applied Optics 7 (1968) 1711-1714.
[2] For example, the VASARI Project developed a system using 7 broad-band interference filters, capable of a resolution of 20 pixels/mm: Saunders, D and Cupitt, J, Image processing at the National Gallery: the VASARI project, National Gallery Technical Bulletin 14 (1993) 72-85, while the CRISATEL Project uses a system with 13 narrow-band interference filters, with a resolution of 12,000 x 30,000 pixels: Lahanier, C et al., CRISATEL: High definition spectral digitisation of paintings with simulation of varnish removal, ICOM-CC 13th Triennial Meeting, Rio de Janeiro (2002) 295-300.
[3] BL Imaging Services used a Sinar 5”x 4” camera body with a Phase One PowerPhase FX digital scanning back, with a 6000 x 8400 pixel CCD chip.
[4] Balas, C et al., A novel hyper-spectral imaging apparatus for the non-destructive analysis of objects of artistic and historic value, Journal of Cultural Heritage 4 (2003) 330-337.
[5] Note that Tischendorf refers to the red ink as “minium”, while Kirsopp Lake and Milne & Skeat refer to it as “vermilion”. They are only using these terms as colour names, not as indications of the chemical nature of the pigments.
[6] Aceto, M., Agostino, A., Boccaleri, E. and Garlanda, A.C., The Vercelli Gospels laid open: an investigation into the inks used to write the oldest Gospels in Latin, X-ray Spectrometry 37 (2008) 286-292.
Images
 |
| Fig. 1. Detail of folio 88 showing the word PSALMA in red |
 |
| Fig. 2. Reflectance spectra of parchment, red and black inks |
 |
| Fig. 3. Comparison of black inks |
 |
| Fig. 4. Comparison of red inks |